GeoPython
Welcome to GeoPython—a self-paced introduction to Python for geospatial analysis and visualization. The material is written for learners who are new or returning to Python and want a clear path from syntax to vector and raster workflows in common open-source libraries.
Course map
The six modules build in order: core Python, how geographic data is represented, vector analysis, raster analysis, visualization, then follow-on topics and resources.
graph LR
    A[Module 1<br/>Python basics] --> B[Module 2<br/>GIS fundamentals]
    B --> C[Module 3<br/>Vector analysis]
    C --> D[Module 4<br/>Raster analysis]
    D --> E[Module 5<br/>Visualization]
    E --> F[Module 6<br/>Next steps]
Want more depth?
For a longer course, projects, and support options, see krishnaglodha.com/courses.
What is GIS?
GIS (Geographic Information System) is a computer-based system used to collect, store, manage, analyze, and visualize geographic or location-based data. It allows users to map real-world features, study patterns, and understand relationships between different data layers, helping in planning, decision-making, resource management, and solving real-world problems efficiently.
You already use “GIS”—you just don’t call it that yet
When you search for a place on Google Maps, ask for directions, or tap Nearby (cafés, fuel, ATMs), your phone is doing geospatial work: it combines where you are, where targets are, roads or paths, and rules (shortest time, avoid tolls, open now).
Everyday maps (examples)
Route planning, local search, and “what’s near me?” are the same family of questions as many GIS workflows—here are a few familiar screenshots (your apps may look slightly different). Click an image to open it full screen (this works for most figures across the site); click the dark backdrop or ×, or press Escape, to close.
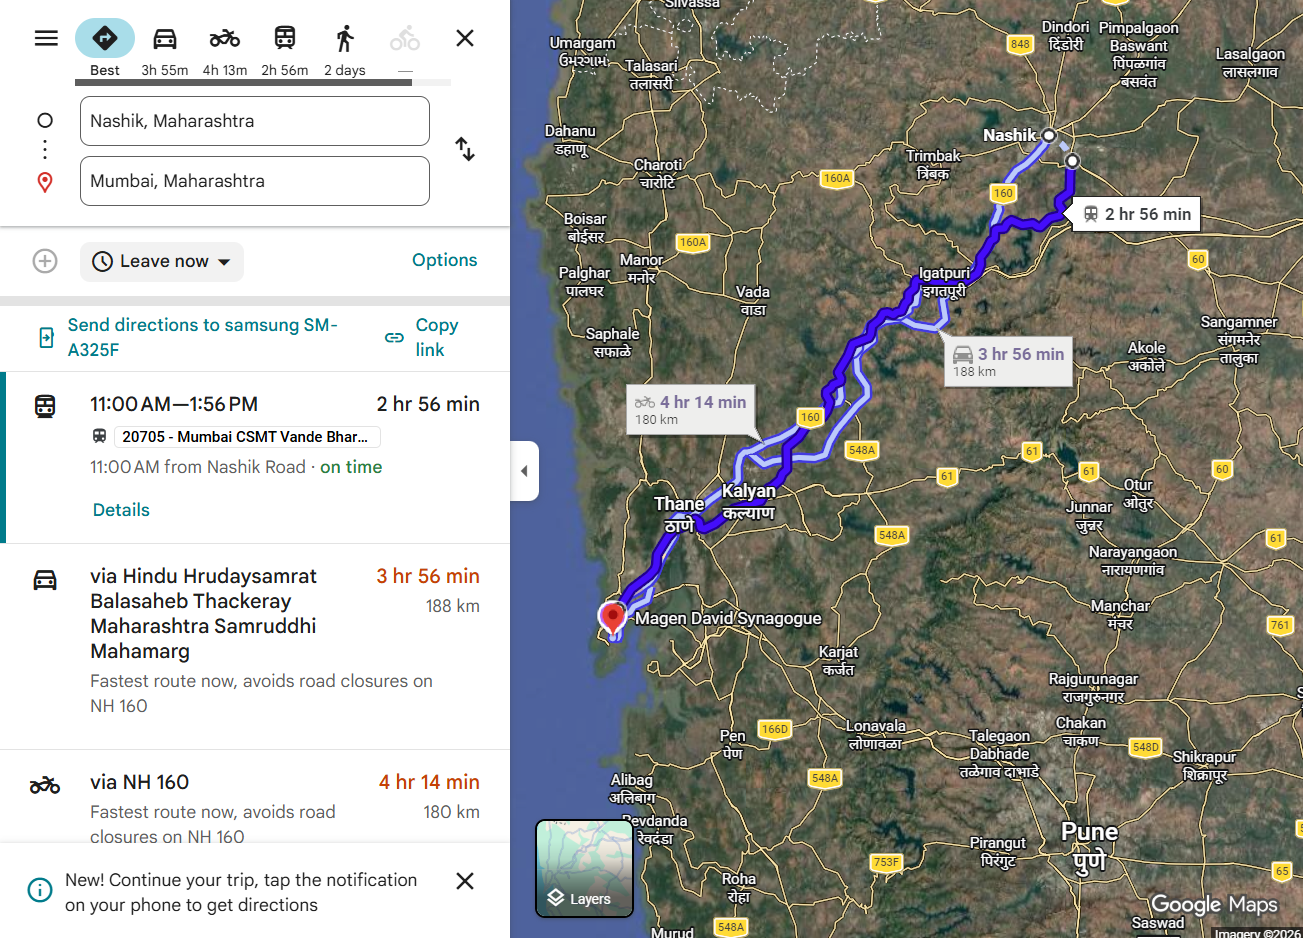
1. Route Search in Google Maps
When you search for a route on Google Maps, for example from Nashik to Mumbai, it displays the best possible path. Do you know how this routing system works behind the scenes?
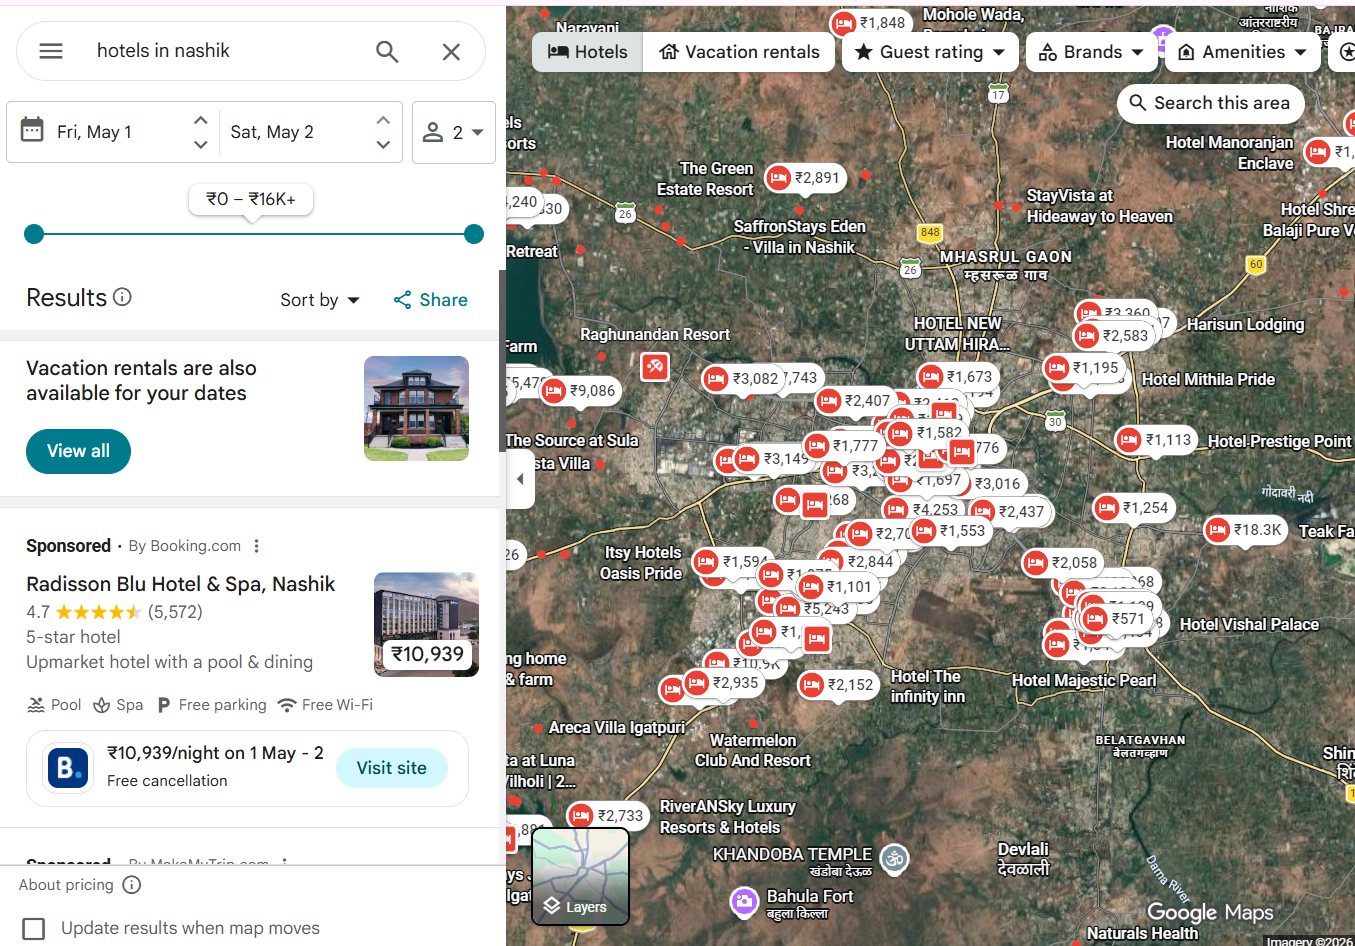
2. Hotel Search
When you search for hotels, such as “hotels in Nashik,” Google Maps shows a list of nearby hotels. Do you know how it identifies and ranks these results?
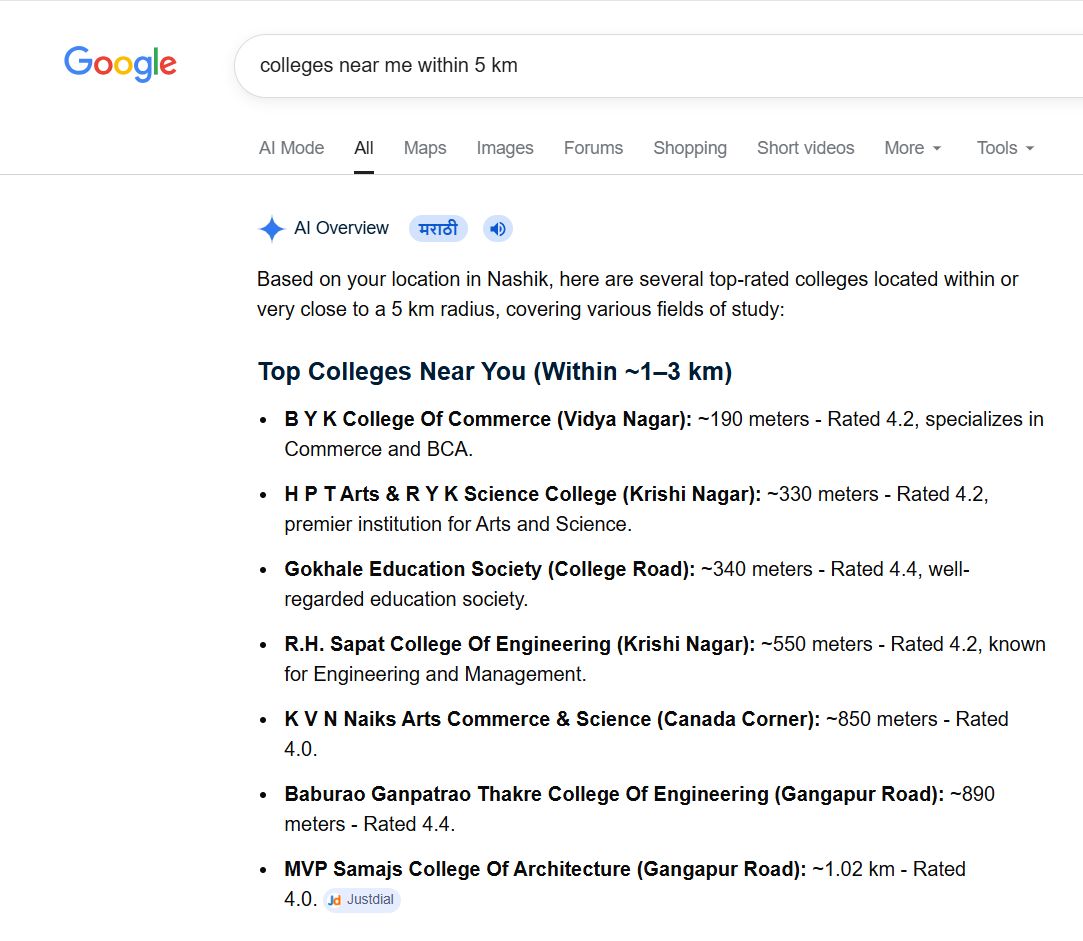
3. Nearby Place Search (Distance-based)
When you search for places within a specific distance, such as 1 km or 10 km, the system returns nearby results. Do you know how it calculates and filters locations based on distance?
Modules
Module 1: Python Basics
- Programming, RAM vs databases (volatile memory, disk persistence, diagram), and Python in context
- Variables, types, strings, and collections (lists, tuples, sets, dictionaries)
- Conditionals,
for/while, functions, and imports - Text files: paths, UTF-8,
with open,pathlib - NumPy:
ndarray, vectorized math - pandas:
DataFrame/Series, create, access, filter, add/edit/drop, missing values, CSV I/O - Practice problems with collapsible solutions (cities, weather, countries, files, pandas)
Module 2: GIS Fundamentals
- What GIS does: locations + attributes; vector vs raster and typical uses
- Vector: point, line, polygon (with sample GeoJSON); raster variants (continuous, categorical, multi-band) and TIFF / GeoTIFF (figures under
docs/assets/) - CRS: geographic vs projected, EPSG, datum in brief, reproject vs assign, common mistakes, and CRS figures in the chapter
- Open and inspect vector layers and relate wrong-CRS choices to the map examples (Natural Earth-style paths where used)
Module 3: Vector Data & Analysis
- Vector formats, multipart geometries, Shapely (buffer, union, intersection, predicates)
- GeoPandas:
GeoDataFrame,geometrycolumn, CRS on the table, read–filter–reproject–export - Basics assignment path: geojson.io, Shapely + small GeoPandas tasks before advanced topics
- Spatial joins, overlays, creating new geometries, exports, and practice problems
Module 4: Raster Data & Analysis
- Raster as a grid (resolution, extent, CRS, NoData, bands, dtypes)
rasteriorecipes and workflows: read/inspect, stats, mask/clip, merge, resampling; bundledTiff_1.tif/Tiff_2.tifindocs/assets/tiff/- Raster–vector integration, NoData handling, a basics assignment on bundled GeoTIFFs (before Advance Analytics), and practice (elevation-style and multi-criteria examples)
Module 5: Visualization with Matplotlib & Leafmap
- Matplotlib: figures/axes,
GeoDataFrame.plot, and raster plots withrasterio(display, colormap, histogram, NoData masking, window/crop, overlays, subplots);pip installmatplotlib, numpy, rasterio - Leafmap: interactive maps—create map, basemaps, markers, GeoJSON,
to_htmlexport;pip install leafmapand optionallocaltileserver; example screenshots indocs/assets/ - Further sections: GeoPandas layer stacks and choropleths, popups, export/print, and optional ipyleaflet for deeper widget control
Module 6: Next Steps & Learning Path
- Recap of skills, portfolio and project ideas
- Intermediate Python, cloud GIS, databases, and Streamlit-style directions
- Pointers to advanced topics (ML, big data, DevOps) and curated resources—without repeating the six core modules
Prerequisites
- Python: no prior experience required for Module 1; later modules assume you can run notebooks or scripts.
- GIS: basic map literacy helps (coordinates, layers); CRS ideas are taught in Module 2.
- Environment: Jupyter, VS Code, or Google Colab are all fine—use whichever matches how you run the code cells in each file.
Data and materials in this repository
- Bundled examples under
docs/assets/: sample GeoJSON (includingassets/examples/), diagrams, map screenshots, and packaged outputs used in the vector, raster, and visualization chapters. - Sample GeoTIFFs
Tiff_1.tifandTiff_2.tifindocs/assets/tiff/for raster and visualization exercises (download buttons also appear in the raster module). - Natural Earth and similar teaching layers appear in several chapters; download links and paths are given inside each module where they apply.
- geojson.io is referenced explicitly in the vector basics assignment for drawing and exporting GeoJSON.
What you can build
Typical outcomes from the modules
- Small Python scripts and notebooks that load, clean, and summarize tables (pandas) and arrays (NumPy)
- Vector workflows with GeoPandas and Shapely (read, filter, reproject, spatial join, export)
- Raster workflows with rasterio (read, compute, clip, respect NoData)
- Static maps and raster figures (matplotlib + rasterio) and interactive maps (Leafmap), suitable as starting points for a portfolio README or report figures
Core stack (mind map)
mindmap
  root((GeoPython stack))
    Python core
      Control flow and functions
      Files pathlib UTF-8
    Tables and arrays
      pandas DataFrames
      NumPy ndarrays
    Vector GIS
      GeoPandas
      Shapely
    Raster GIS
      rasterio
    Visualization
      matplotlib
      Leafmap
    Data
      Repo assets GeoJSON
      Natural Earth teaching layers
How to use this site
- Open Module 1: Python Basics and run examples in order.
- Use the Learning Goals at the top of each module as a checklist.
- Try practice sections before expanding the solutions.
- Keep a single folder or repo for your own copies of scripts, outputs, and maps.
Learning outcomes
After working through the modules, you should be able to:
Technical skills
- Read and write short Python programs using collections, loops, functions, files, NumPy, and pandas
- Explain vector vs raster, common file formats, and CRS metadata at a practical level
- Use GeoPandas and Shapely for common vector operations and exports
- Use rasterio for read/compute/clip patterns and NoData awareness
- Produce static maps and raster plots with matplotlib (and rasterio where used) and interactive maps with Leafmap
Practical habits
- Inspect CRS and dtypes before analysis
- Prefer vectorized and library-native operations over ad hoc loops where possible
- Reproducible paths (
pathlib), UTF-8 text, and clear column names in tables
Documentation conventions
- Mermaid figures for flows and stacks
- Runnable code in fenced blocks; longer modules also use practice and solution patterns
- Admonitions (
tip,warning,success) for habits and pitfalls
Get started
Course philosophy
Each module ties syntax to geographic questions: tables and coordinates are not abstract exercises—they are the same objects you will use in GeoPandas, rasterio, and maps.
Happy mapping with Python.